Paper: London social distance estimation
Summary of our paper “Near Real Time Social Distance Estimation in London”, which has been published in the British Computer Society’s Computer Journal.
Cite: James Walsh, Oluwafunmilola Kesa, Andrew Wang, Mihai Ilas, Patrick O’Hara, Oscar Giles, Neil Dhir, Mark Girolami, Theodoros Damoulas, Near Real-Time Social Distance Estimation In London, The Computer Journal, 2023;, bxac160, https://doi.org/10.1093/comjnl/bxac160
Publications:
- Journal paper
- arXiv preprint
- CIUK poster competition 2020 winner
- Summary of the project on the Alan Turing Institute website: Project Odysseus – understanding London ‘busyness’ and exiting lockdown.
- Press coverage
- Wider project statement
1. Introduction
We studied robust object detection and camera calibration in 900 traffic cameras around London. We showed this can be used to monitor social distance in real-time around London, the busiest city in the UK.
The paper also showed that we can develop an end-to-end solution that touches on multiple Machine Learning research areas using multiple data sources to benefit public health and for social good. The project was in collaboration with the Alan Turing Institute (the UK’s national institute for Data Science and AI), the University of Cambridge (us) and the University of Warwick. Research funding was from Lloyd’s Register Foundation.
2. Solution
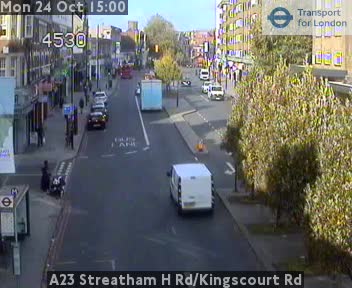
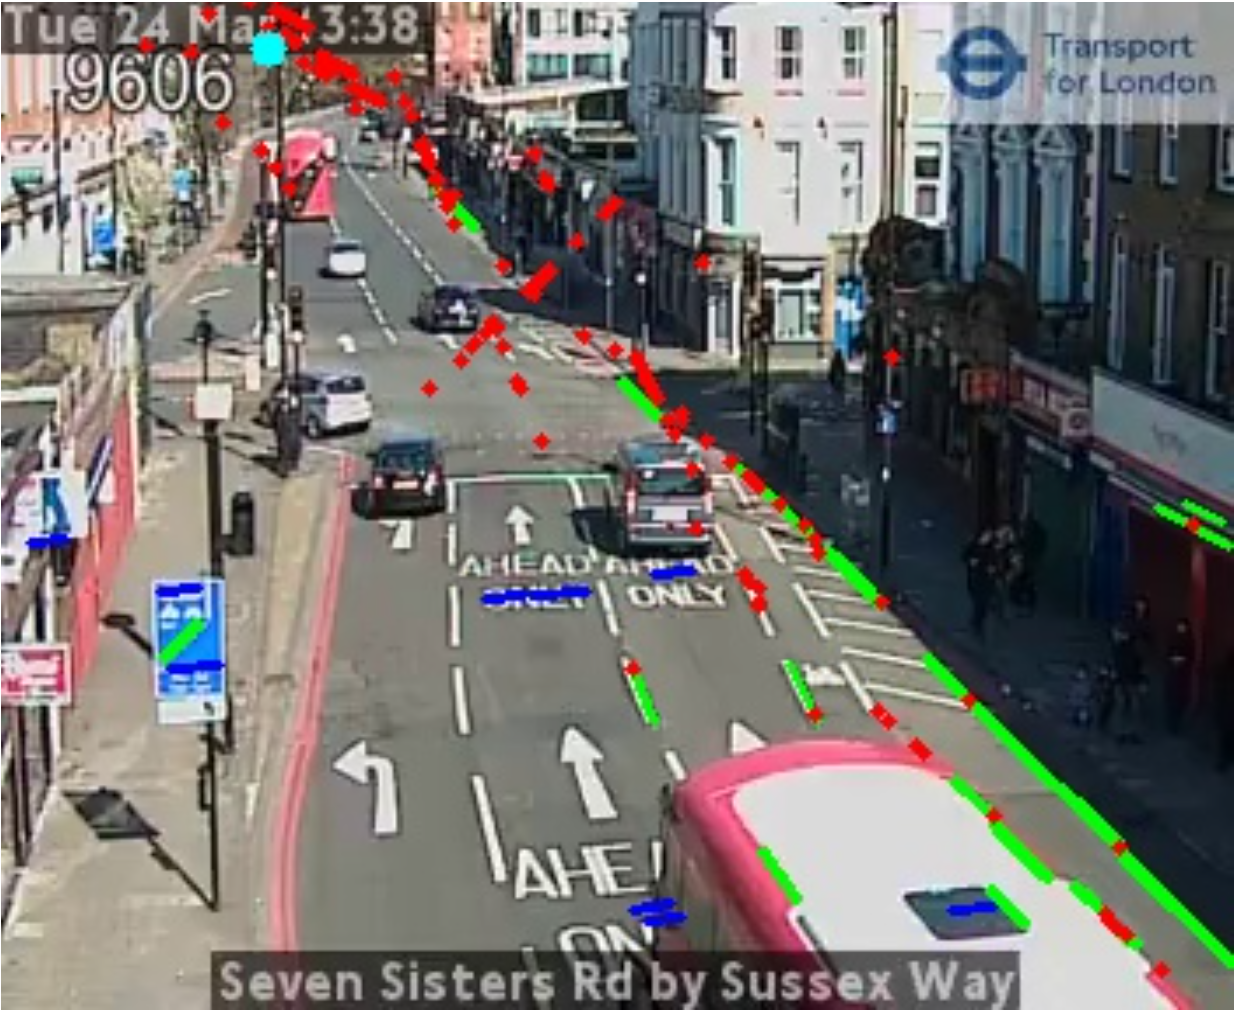
Video footage is provided by Transport for London (TfL) from 900 low-resolution “JamCam” cameras spread across London, and can be viewed live at this site. These images look like:
We use this to detect footfall and measure social distance statistics in real time for these locations around London, continually throughout the pandemic. Previous industrical solutions use, for example, Google movement data or point of sale transaction data which are severely limited. The below diagram shows our approach: object detection and physical distance estimation are fed into an API and live dashboard deployed on Azure.
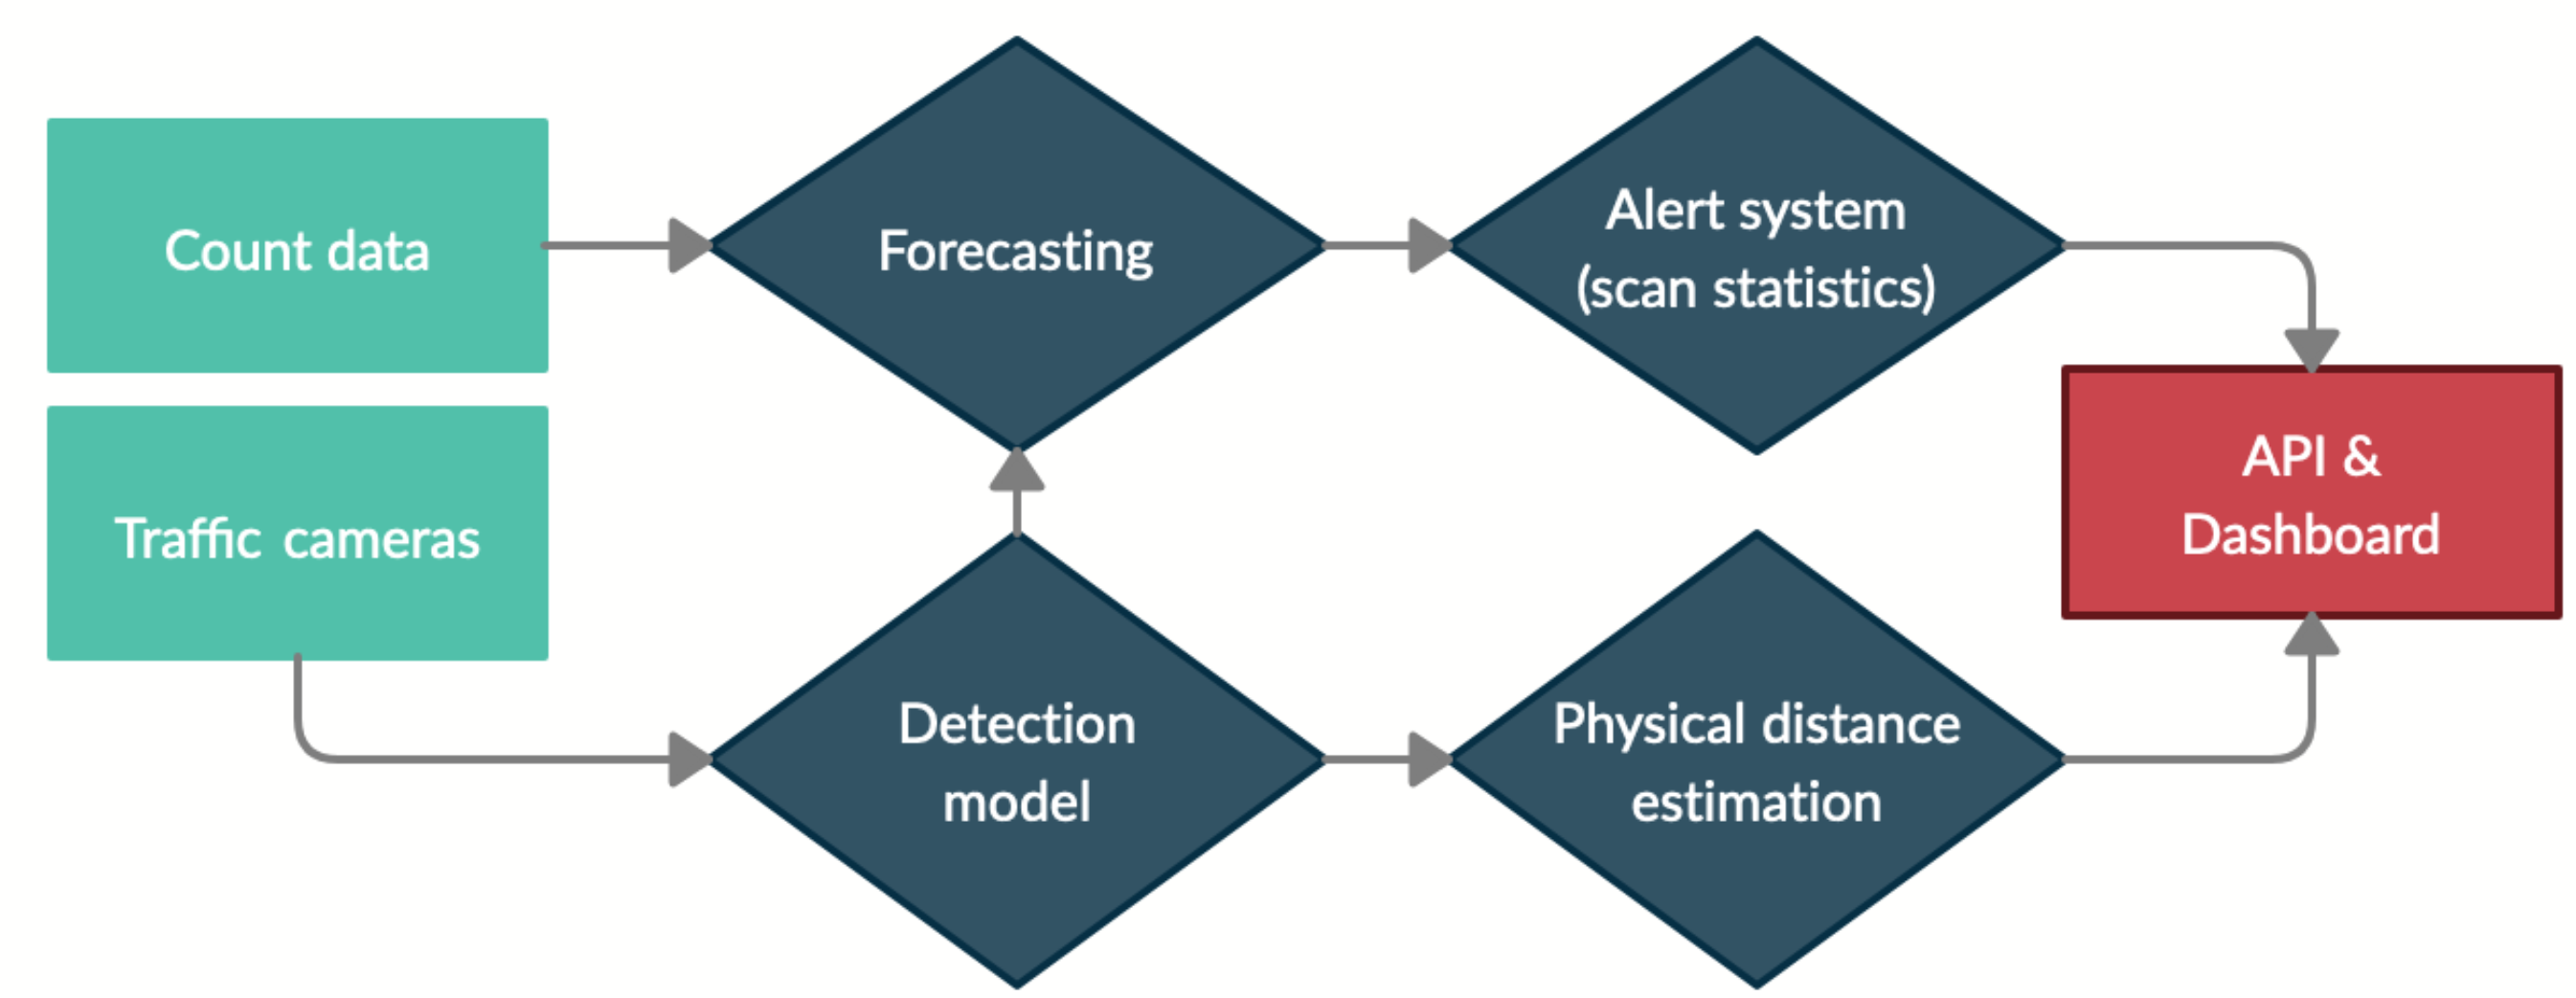
These methods tie in with other concurrent research projects, for example the Institute’s wider COVID approach and air quality monitoring project. These projects integrate multiple large-scale heterogeneous datasets and develop ML models to infer mobility and transportation activity throughout London. The above diagram shows how this other data (e.g. on-the-ground traffic and footfall measurement) can be combined to provide forecasts and alerts.
There are many stages to the main inference pipeline proposed, an each stage is an interesting and ongoing research problem in itself:
- Object detection (high accuracy, real-time inference and challenging conditions)
- World-plane transformation/camera calibration (no a-priori parameters, high robustness, no validation datasets)
- Group detection (graph theory problem)
- Social distance metric calculation
- Others, such as scene stability detection for change point alerting.
3. Results
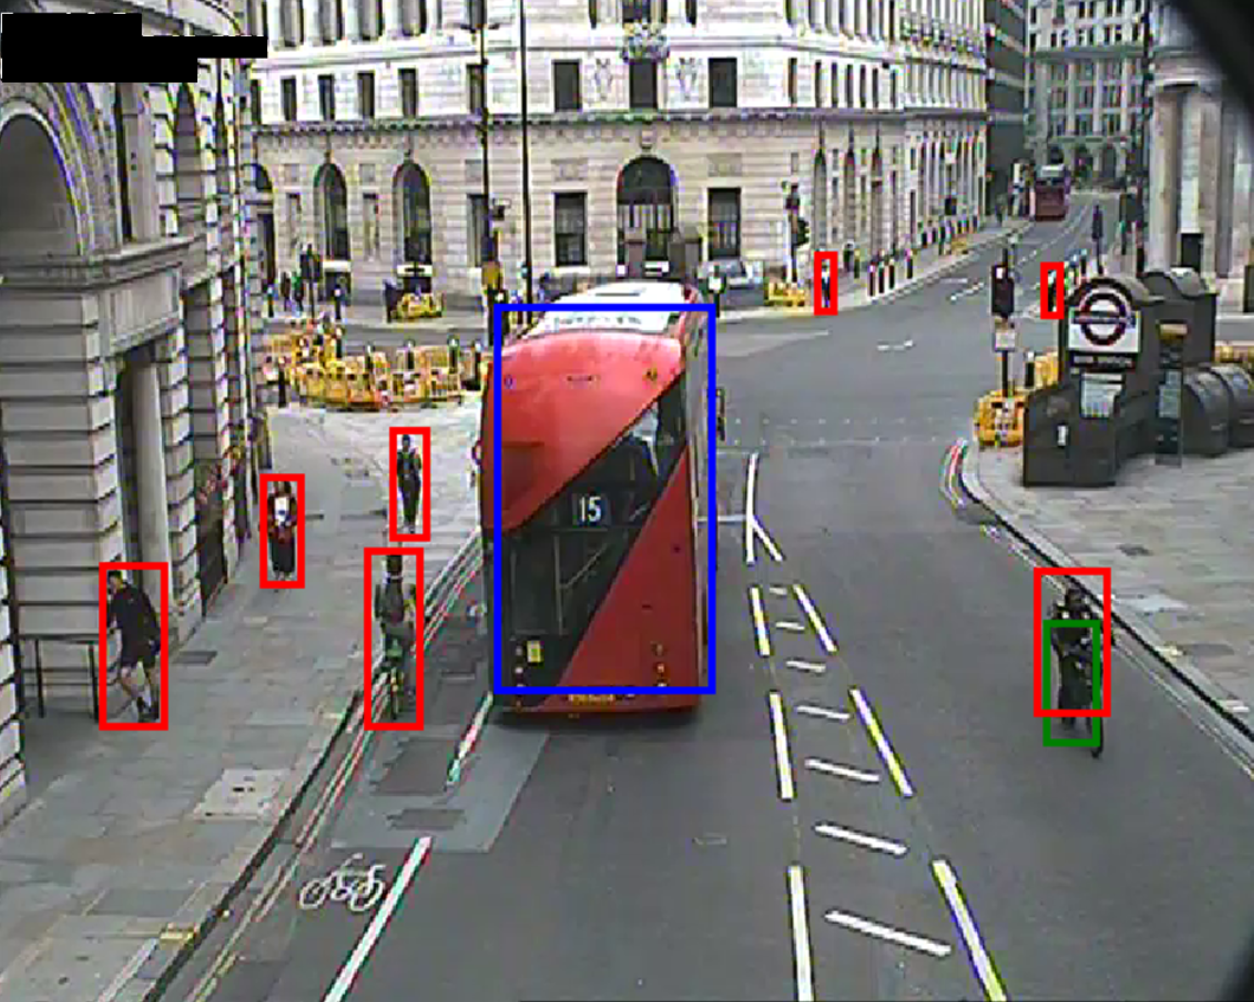
The following images depict the successful implementation of the pipeline:
Object detection using YOLOv4 on a mixture of standard COCO and MIO-TCD and evaluated using our custom dataset (see below)
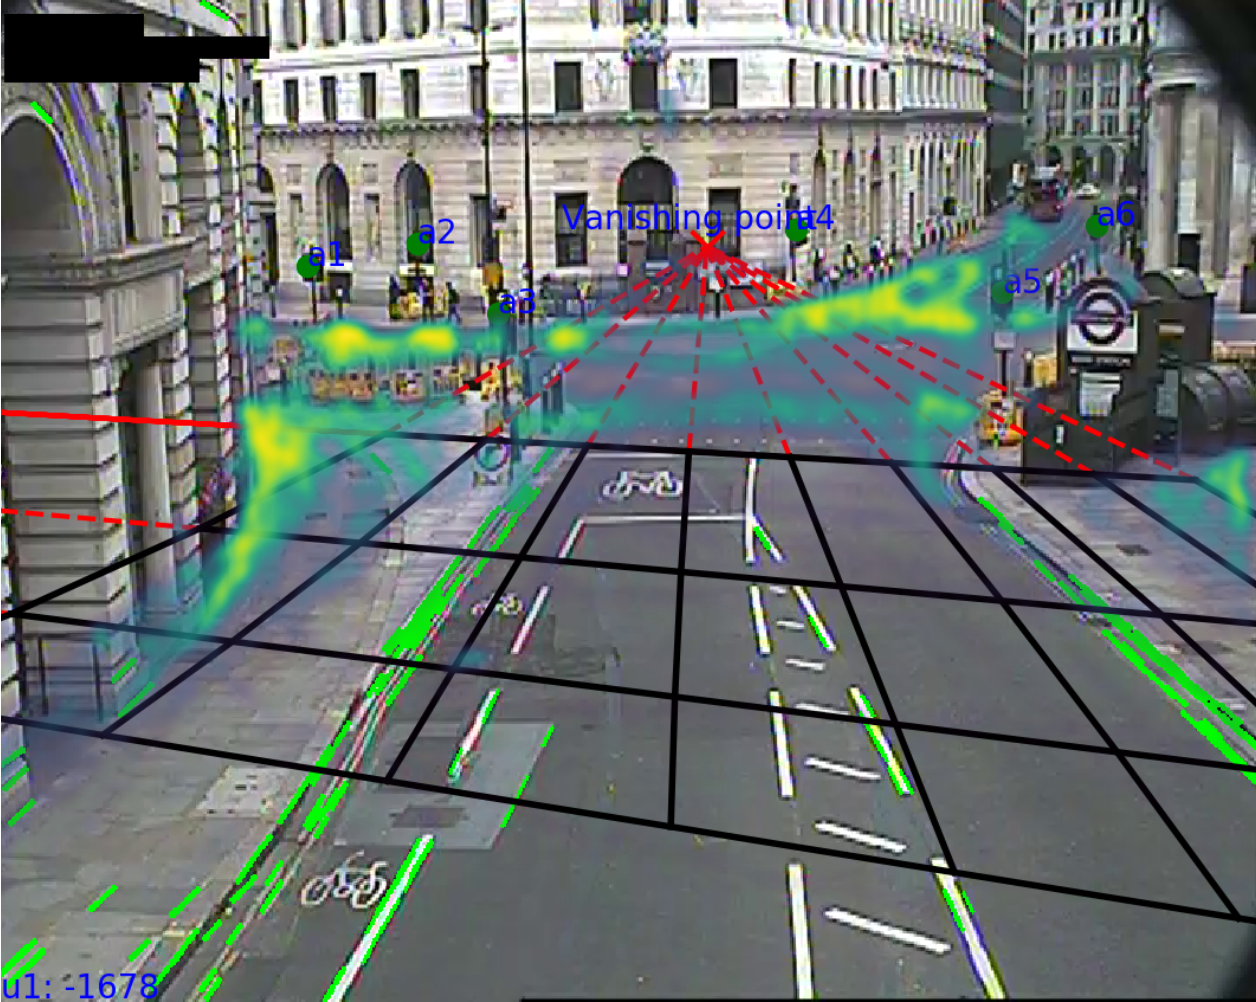
Calibration involving robust camera perspective mapping and world-plane affine transformation (see below)
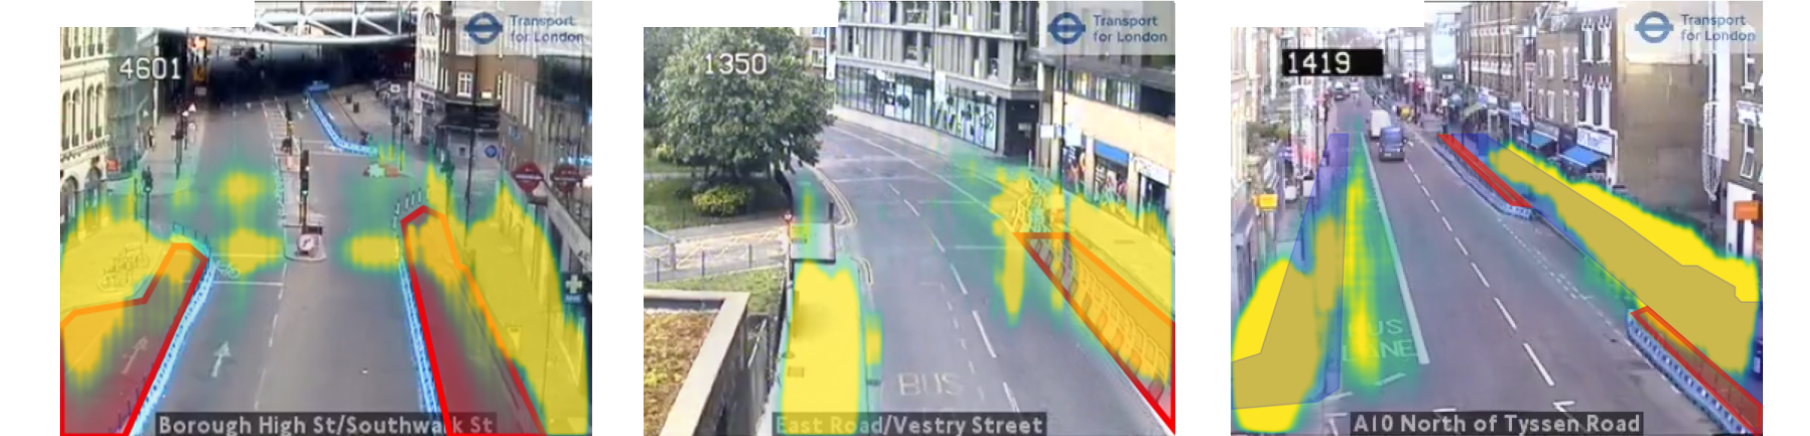
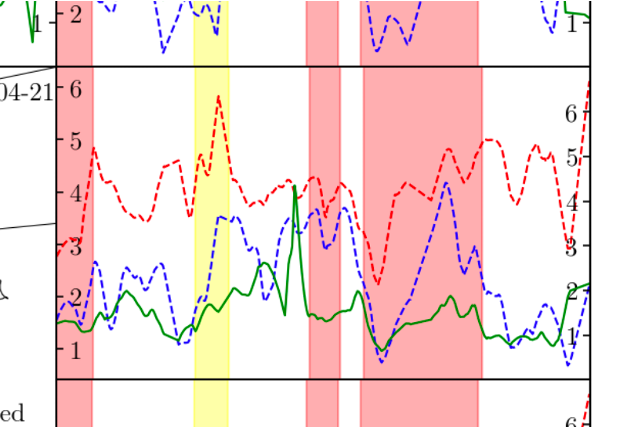
Social distance clustering and aggregation produces metrics time-series at each location. Statistics we measured were total number of people, average inter-group “social” distance and average within-group distance. These statistics allowed us to see how lockdown and policies such as ”work from home” or “eat-out-to-help-out” affected “busyness”, and also specific examples where real local policy intervention such as pavement extension affected social distancing. See the paper for more details.
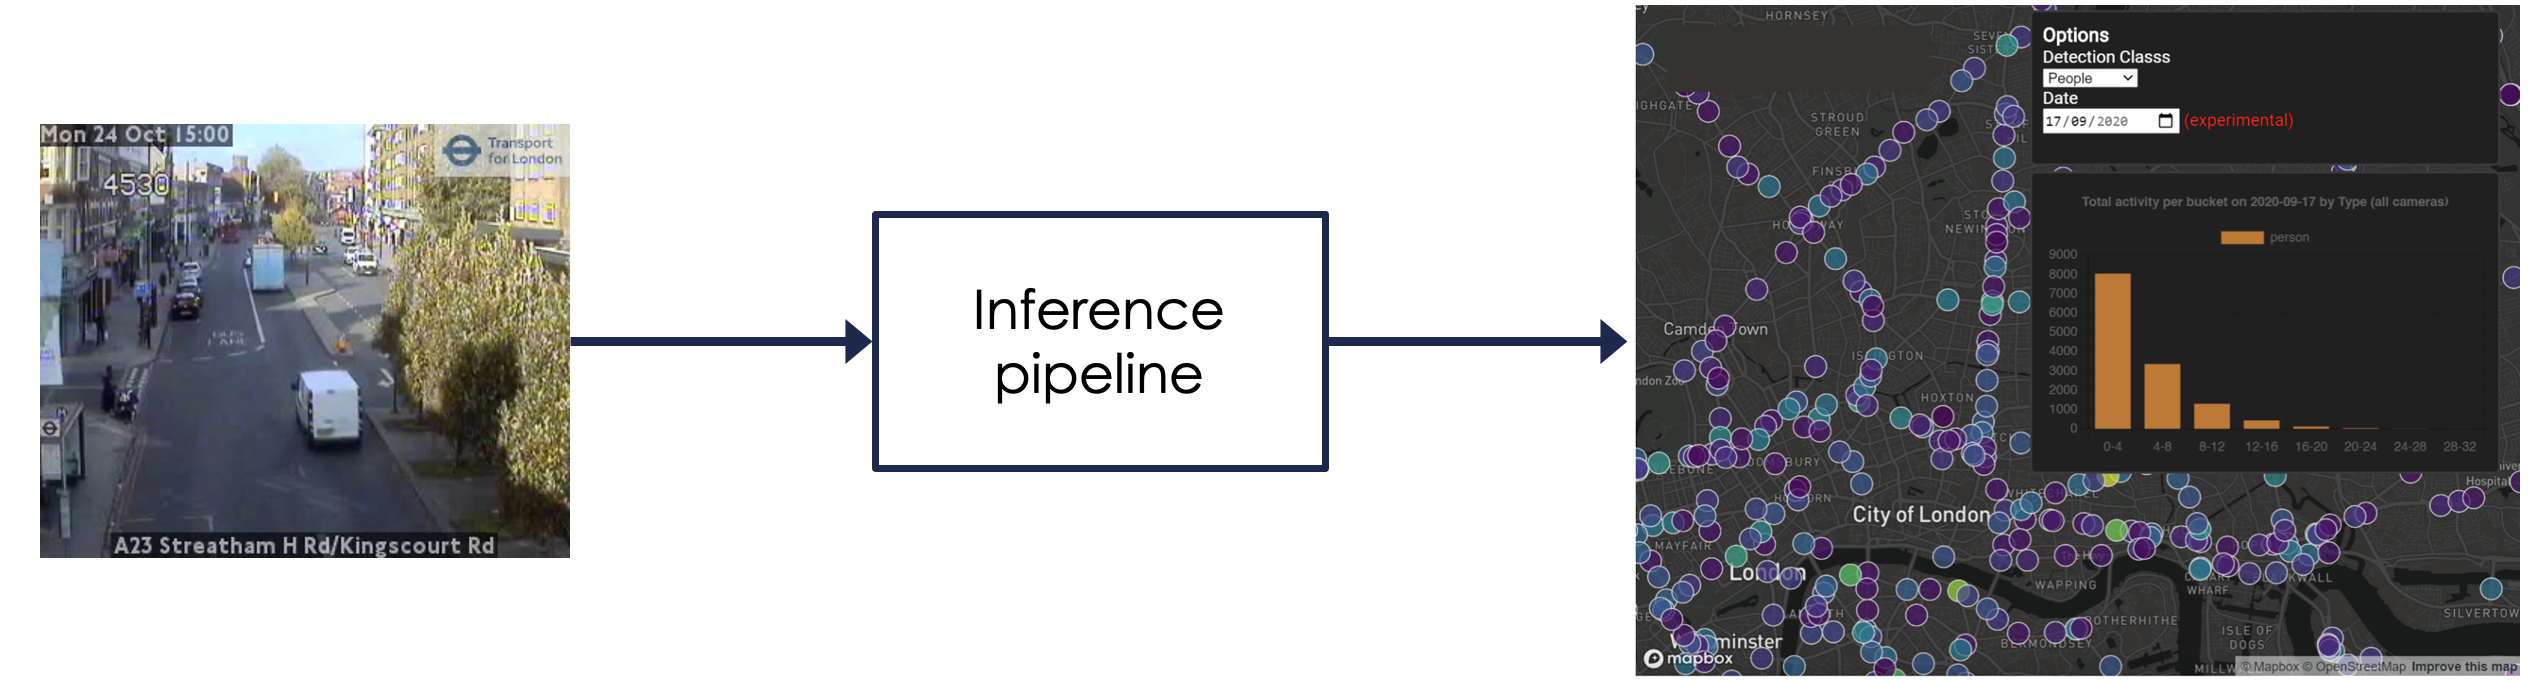
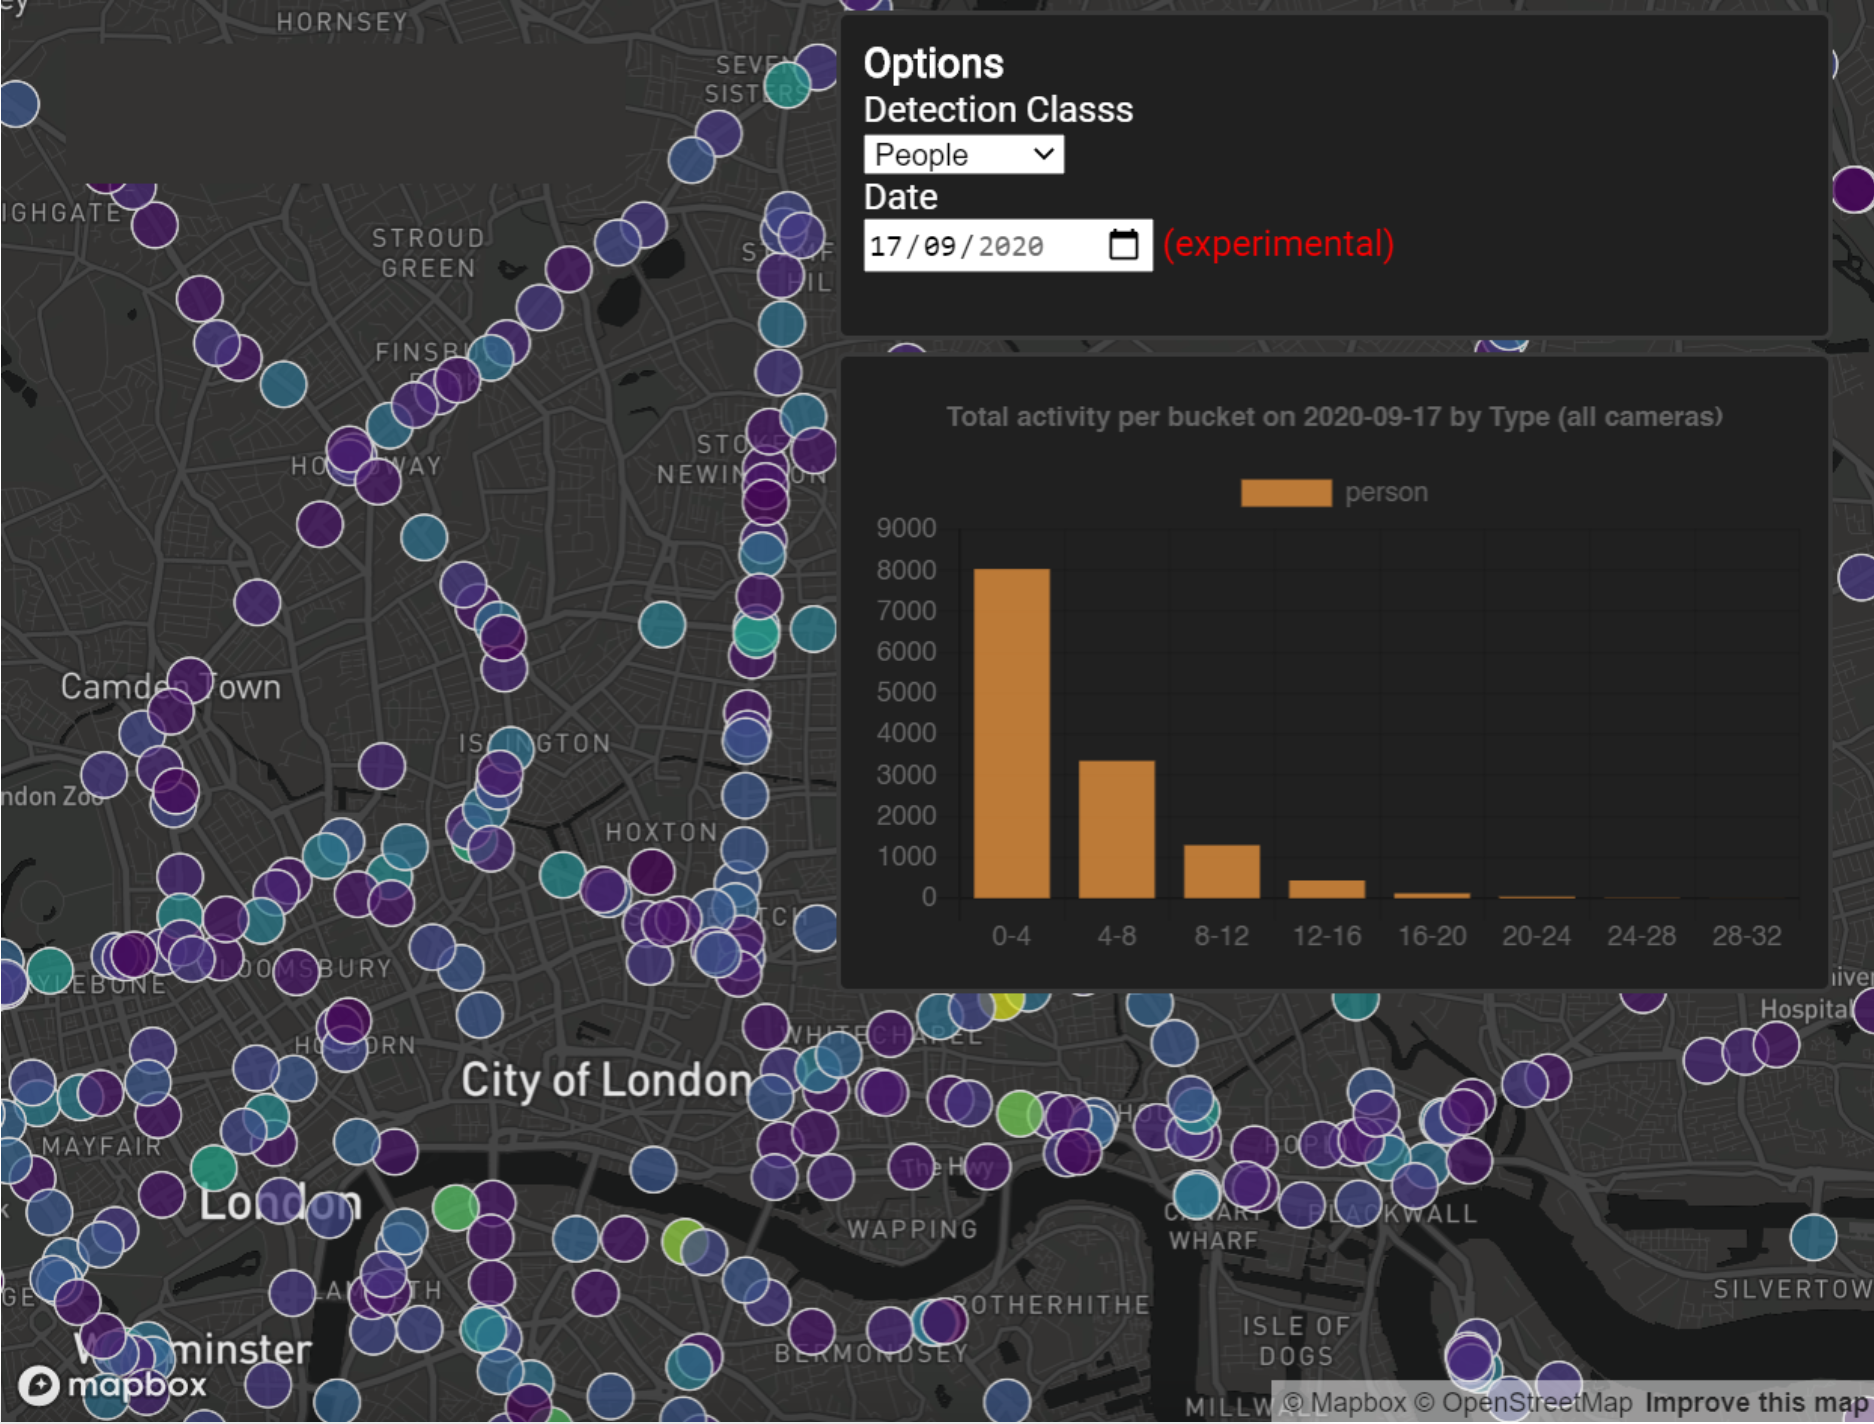
Dashboard deployed to Azure.
A quote from Transport for London:
“TfL says that it implemented over 700 such interventions at the height of the pandemic’s first wave, and that the Turing’s tool provided key data for those decisions”
5. Deep dives
The following couple of sections go into a bit more depth about some of the interesting parts of the paper.
5.1 Camera calibration
The aim of the camera calibration research stage was to transform locations of detected people in image coordinates to the world plane coordinates according to the British National Grid.
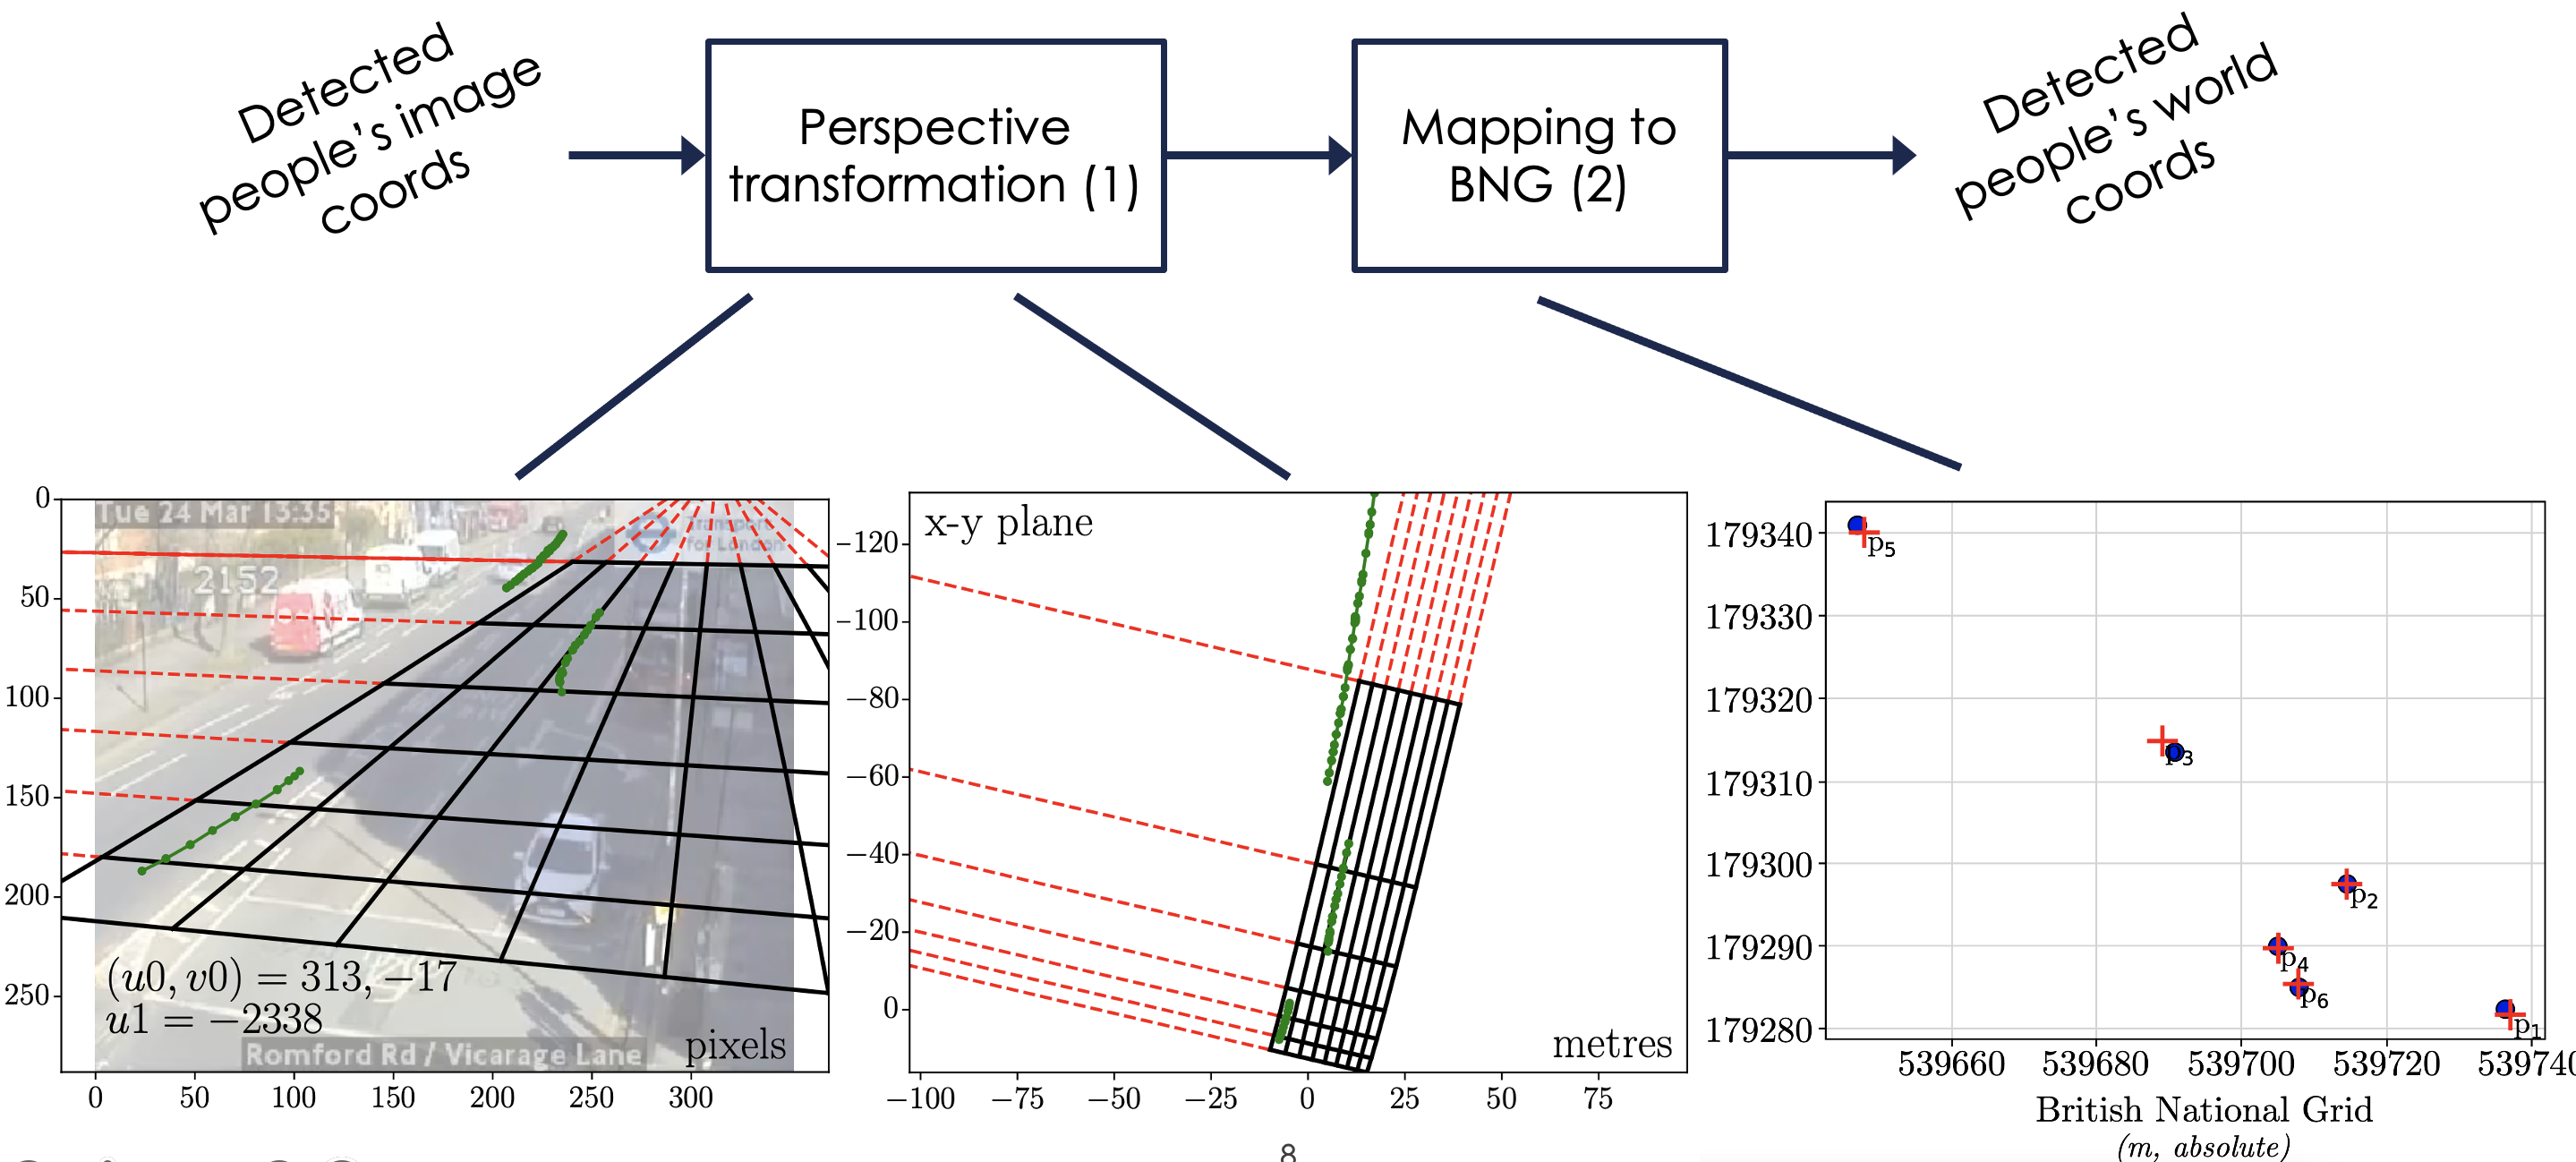
The first stage (1) is to project a perspective image from a camera to an intermediate birds-eye view. Traditionally, this is a simple problem if you konw the camera parameters such as camera height, perspective angle, focal length etc. However, this is a difficult problem as we need to estimate or assume all these parameters for 900+ cameras automatically. The camera views are highly variable in terms of lighting, quality, clutter and road curvature. Methods from the literature that are used for traditional traffic cameras are often pre-calibrated using checkerboards or long, straight lines. We derive a formula to transform $u$ to $x$ that depends on the vanishing points of paralell and orthogonal lines in images. The vanishing points are found by a majority voting method using a robust algorithm involving the Canny edge detector, for example
The second image is to calibrate this arbitrary birds eye view to real-world London coordinates using affine transformations. To achieve this, every camera view is labelled with ~5 manual urban furniture anchors for which their positions are known in the British Natioal Grid, such as traffic lights. The transformations (such as rotations, translations and affine transformations) are then fit and validated by dropping out these anchors.
5.2 Object detection
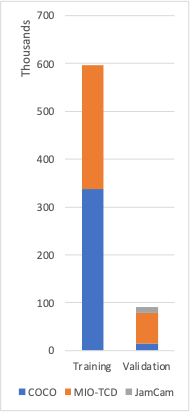
There are a huge variety of models and datasets available for performing object detection. We found that YOLOv4 performed the best. The detector was trained on two datasets, where the labels were collapsed into 6 common categories [person, bike, car, motorbike, bus, truck]:
- COCO: “a large-scale object detection, segmentation, and captioning dataset.”
- MIO-TCD: “a challenge dataset for localization and identification of vehicles”
The detector was validated additionally on a custom dataset of labelled JamCam images. The number of annotations used is as follows, where we used as many high quality bounding boxes as possible:
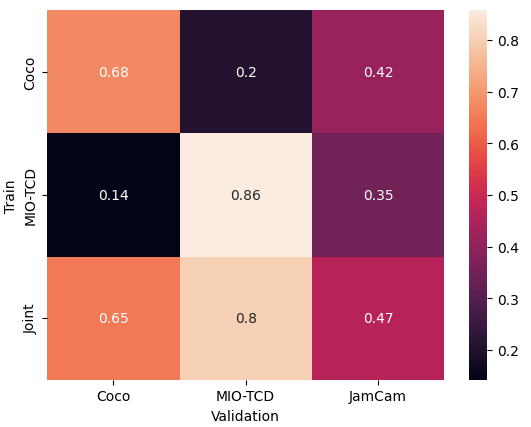
The results are as follows. The best validation performance on the custom dataset was achieved by the detector trained on the joint dataset. As expected, the best validation performance on each of COCO and MIO-TCD was achieved by detectors trained solely on each dataset. The mean average precision results at IoU threshold of 0.5 are summarised below:
6. Ethical considerations
We made the following ethical considerations during the research:
- Continuous review from the Alan Turing Institute’s Ethical Advisory Group to make sure all models have no bias elements
- Image data retention policy to delete all images upon processing and aggregating, so that only numbers are visible at the end
- Restrictive temporal sampling to 10 seconds every 4 minutes
- Restrictive spatial sampling to 0.1 megapixels: “Any capacity to personally identify an individual is inhibited. Thus only their humanoid likeness is utilised for detection.”
7. Future directions
Here are 3 potential future directions:
- Improve overall end-to-end accuracy and speed (e.g. using YOLOv7)
- More thorough error analysis of individual components
- Modelling for time-series forecasting